
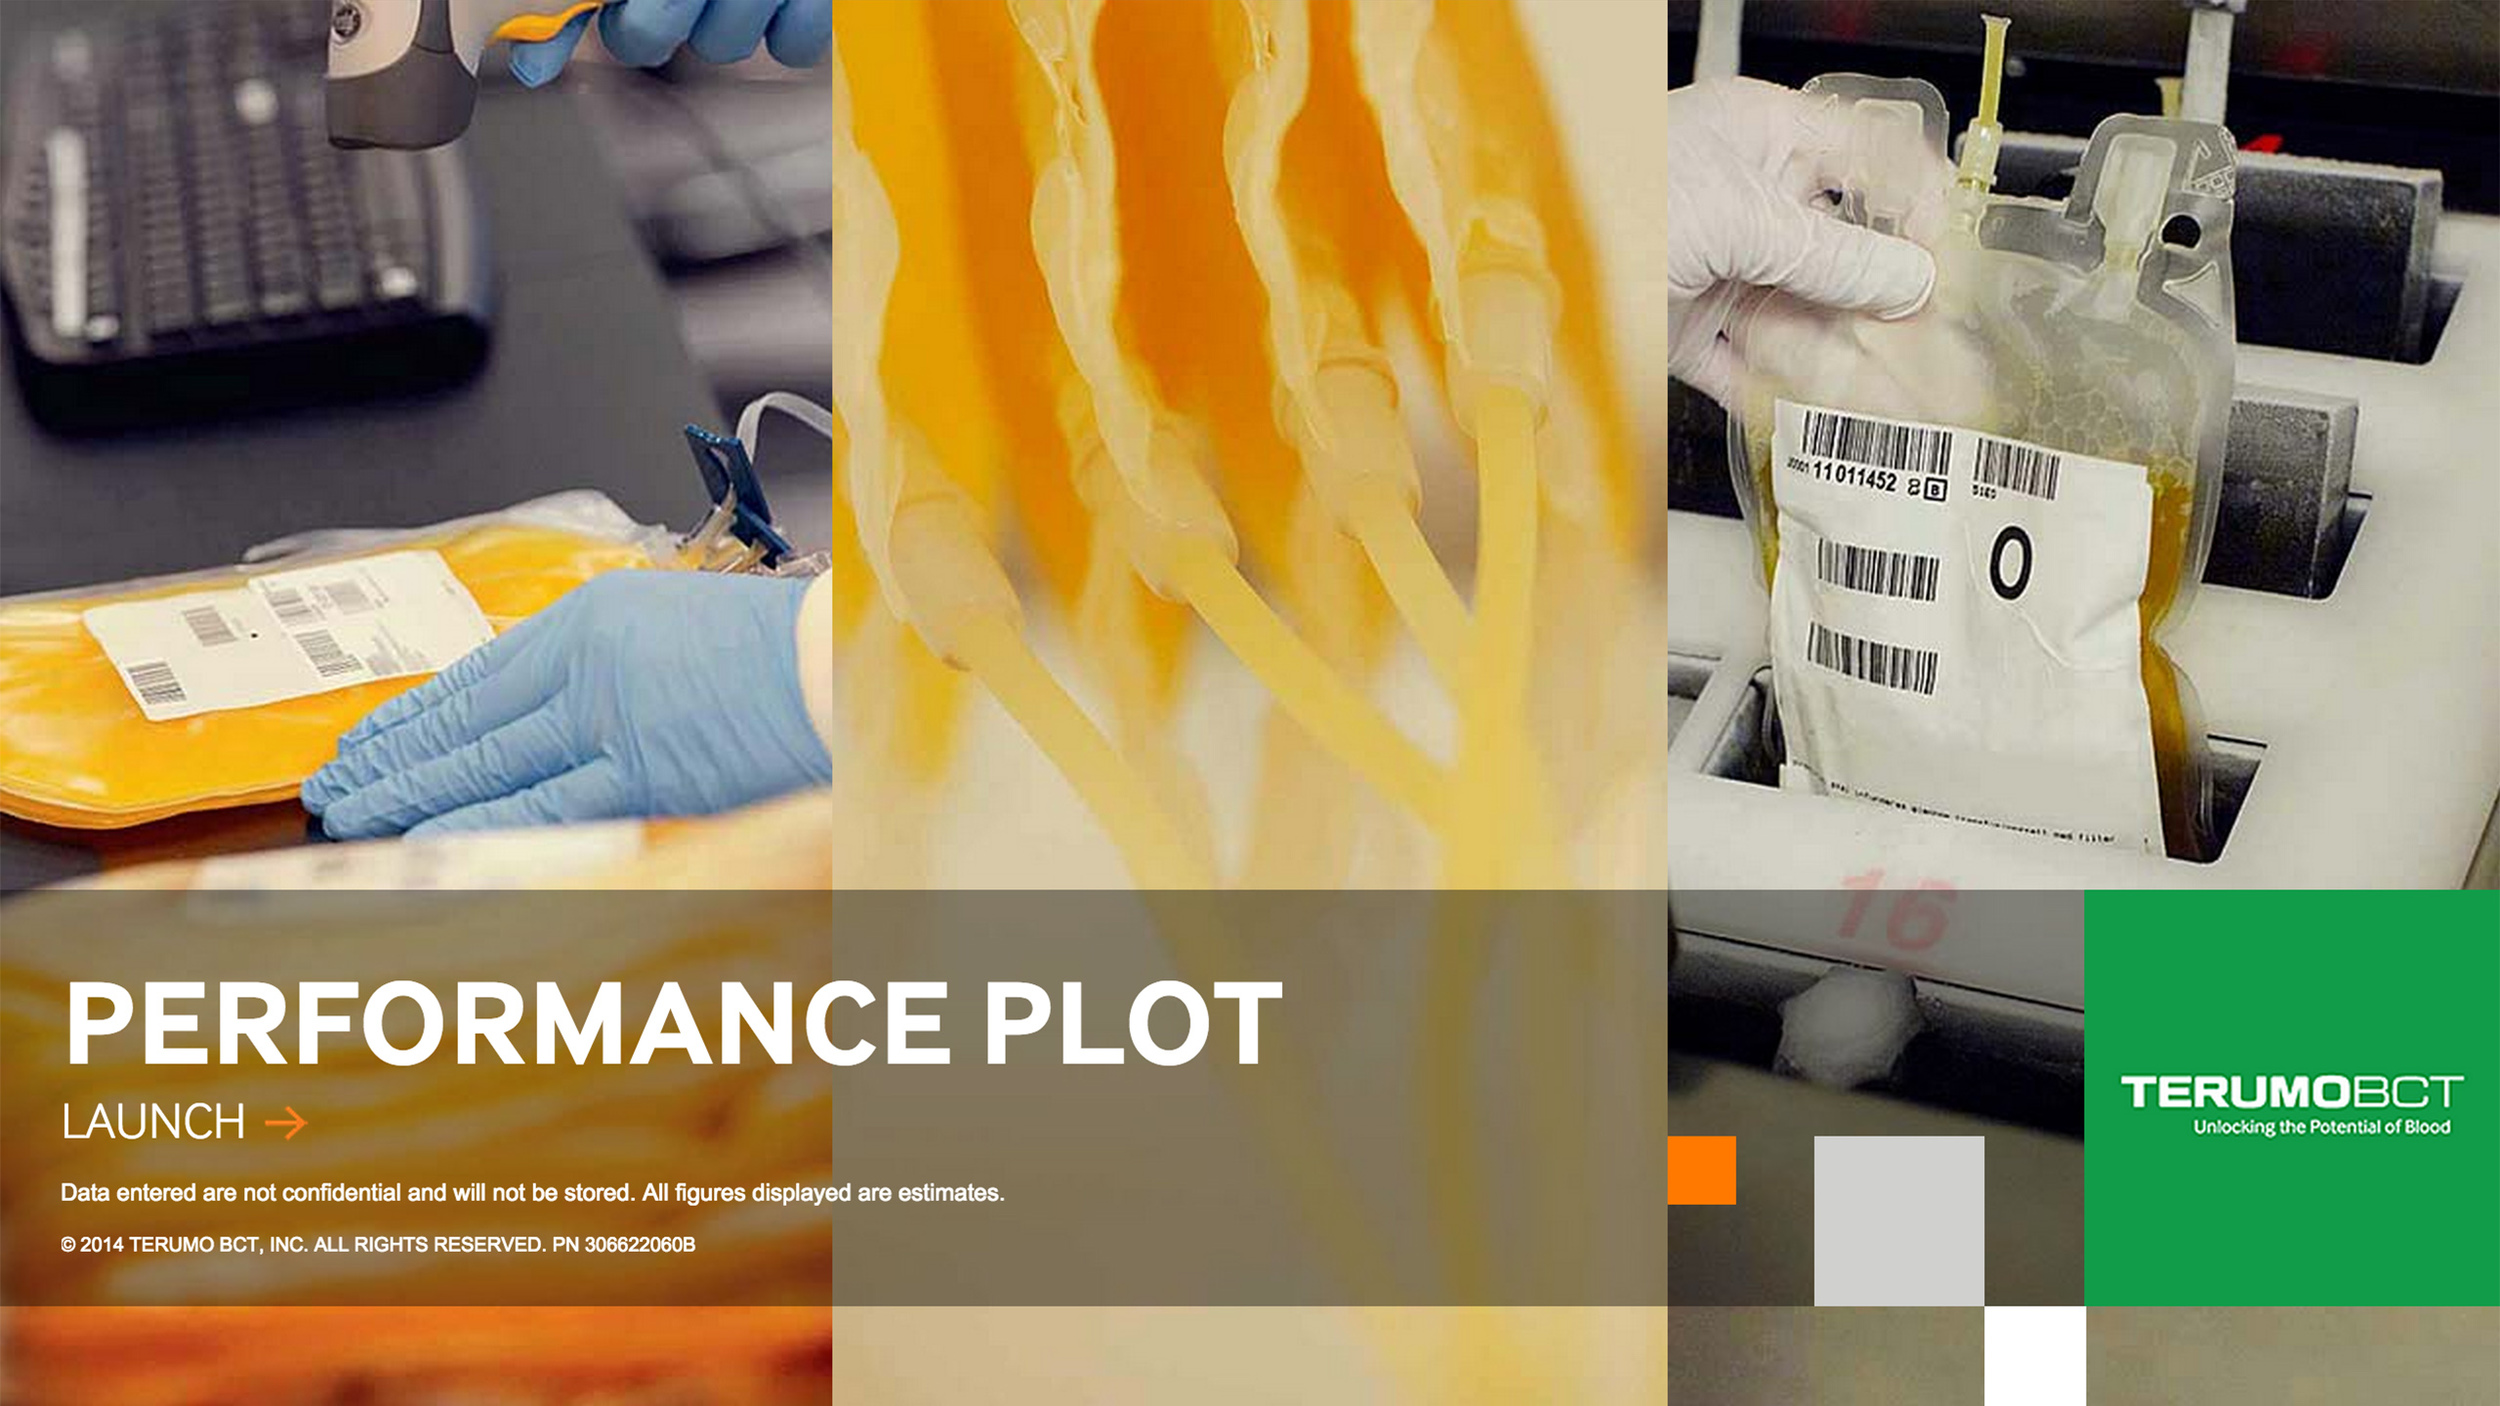
Project Study:
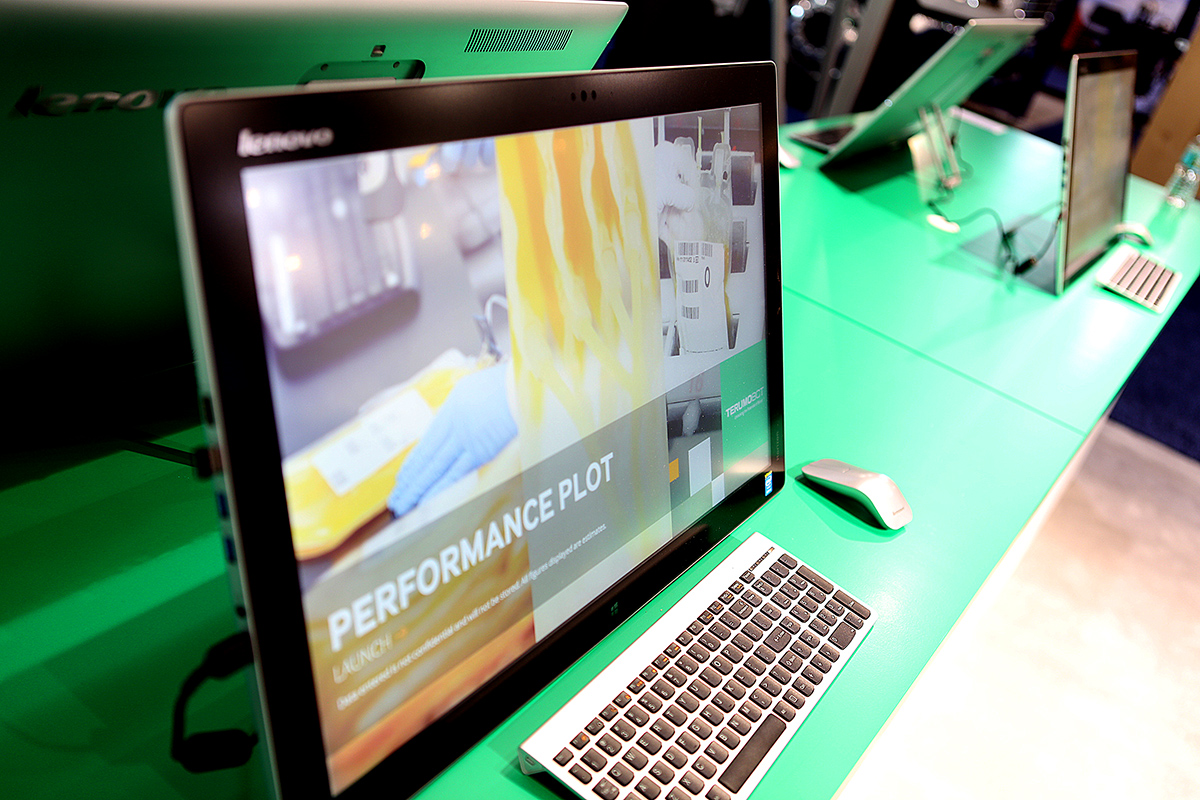
We ended up calling it the Performance Plot.
A sales support tool that came out of a collaborative effort between our internal MarComm team, Commercialization and Sales leadership. We (MarCommm) needed to position the brand as THE thought leader in this segment. They (Sales) had to actually prove it in conversation with customers. How do you capitalize on tribal knowledge, open the door to a long, consultative sales cycle and build confidence in the brand all at once?
This whole thing actually started as part of a trade show assignment. A big show was coming up, and we in MarComm were dead-set on a big, digital, involved, expensive show-piece that would make people stop and look.
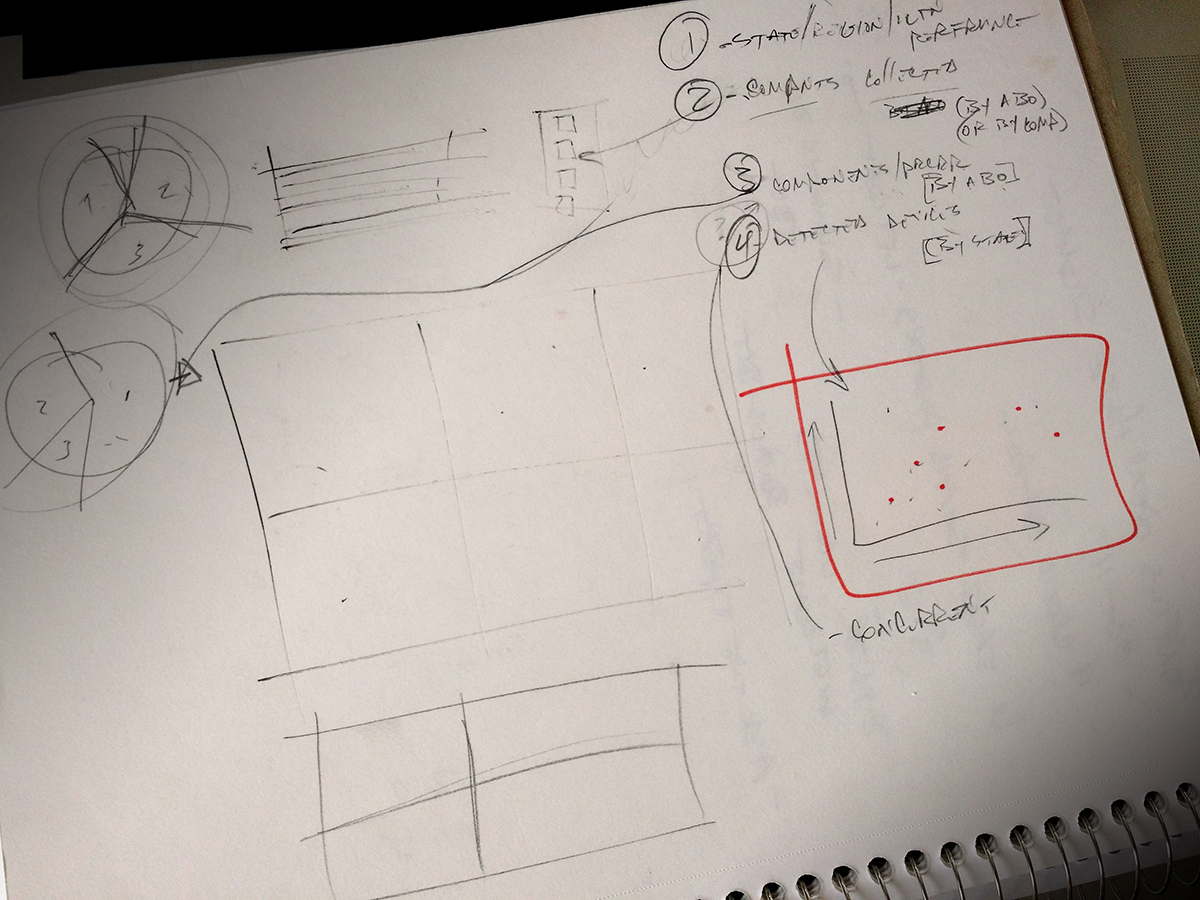
In a budgeting conversation with us about the show-piece, a stakeholder on the product marketing team mentioned a garage project he’d been working on for some time. It was a spreadsheet, and he’d been playing around with visualization…
The Challenge
Give a mature sales team a digital stage on which to quickly demonstrate expertise and depth of knowledge without tripping them up in the details.
The Proposition
If available data were intelligently visualized and effectively paired with the wisdom each member of the sales team brings to work every day, tremendous potential could be realized.
The Guardrails
- It had to be database-driven and easy to update
- Minimal user (sales) input needed to yield maximum emotional (customer) impact
- It had to dovetail with the sales team’s native expertise
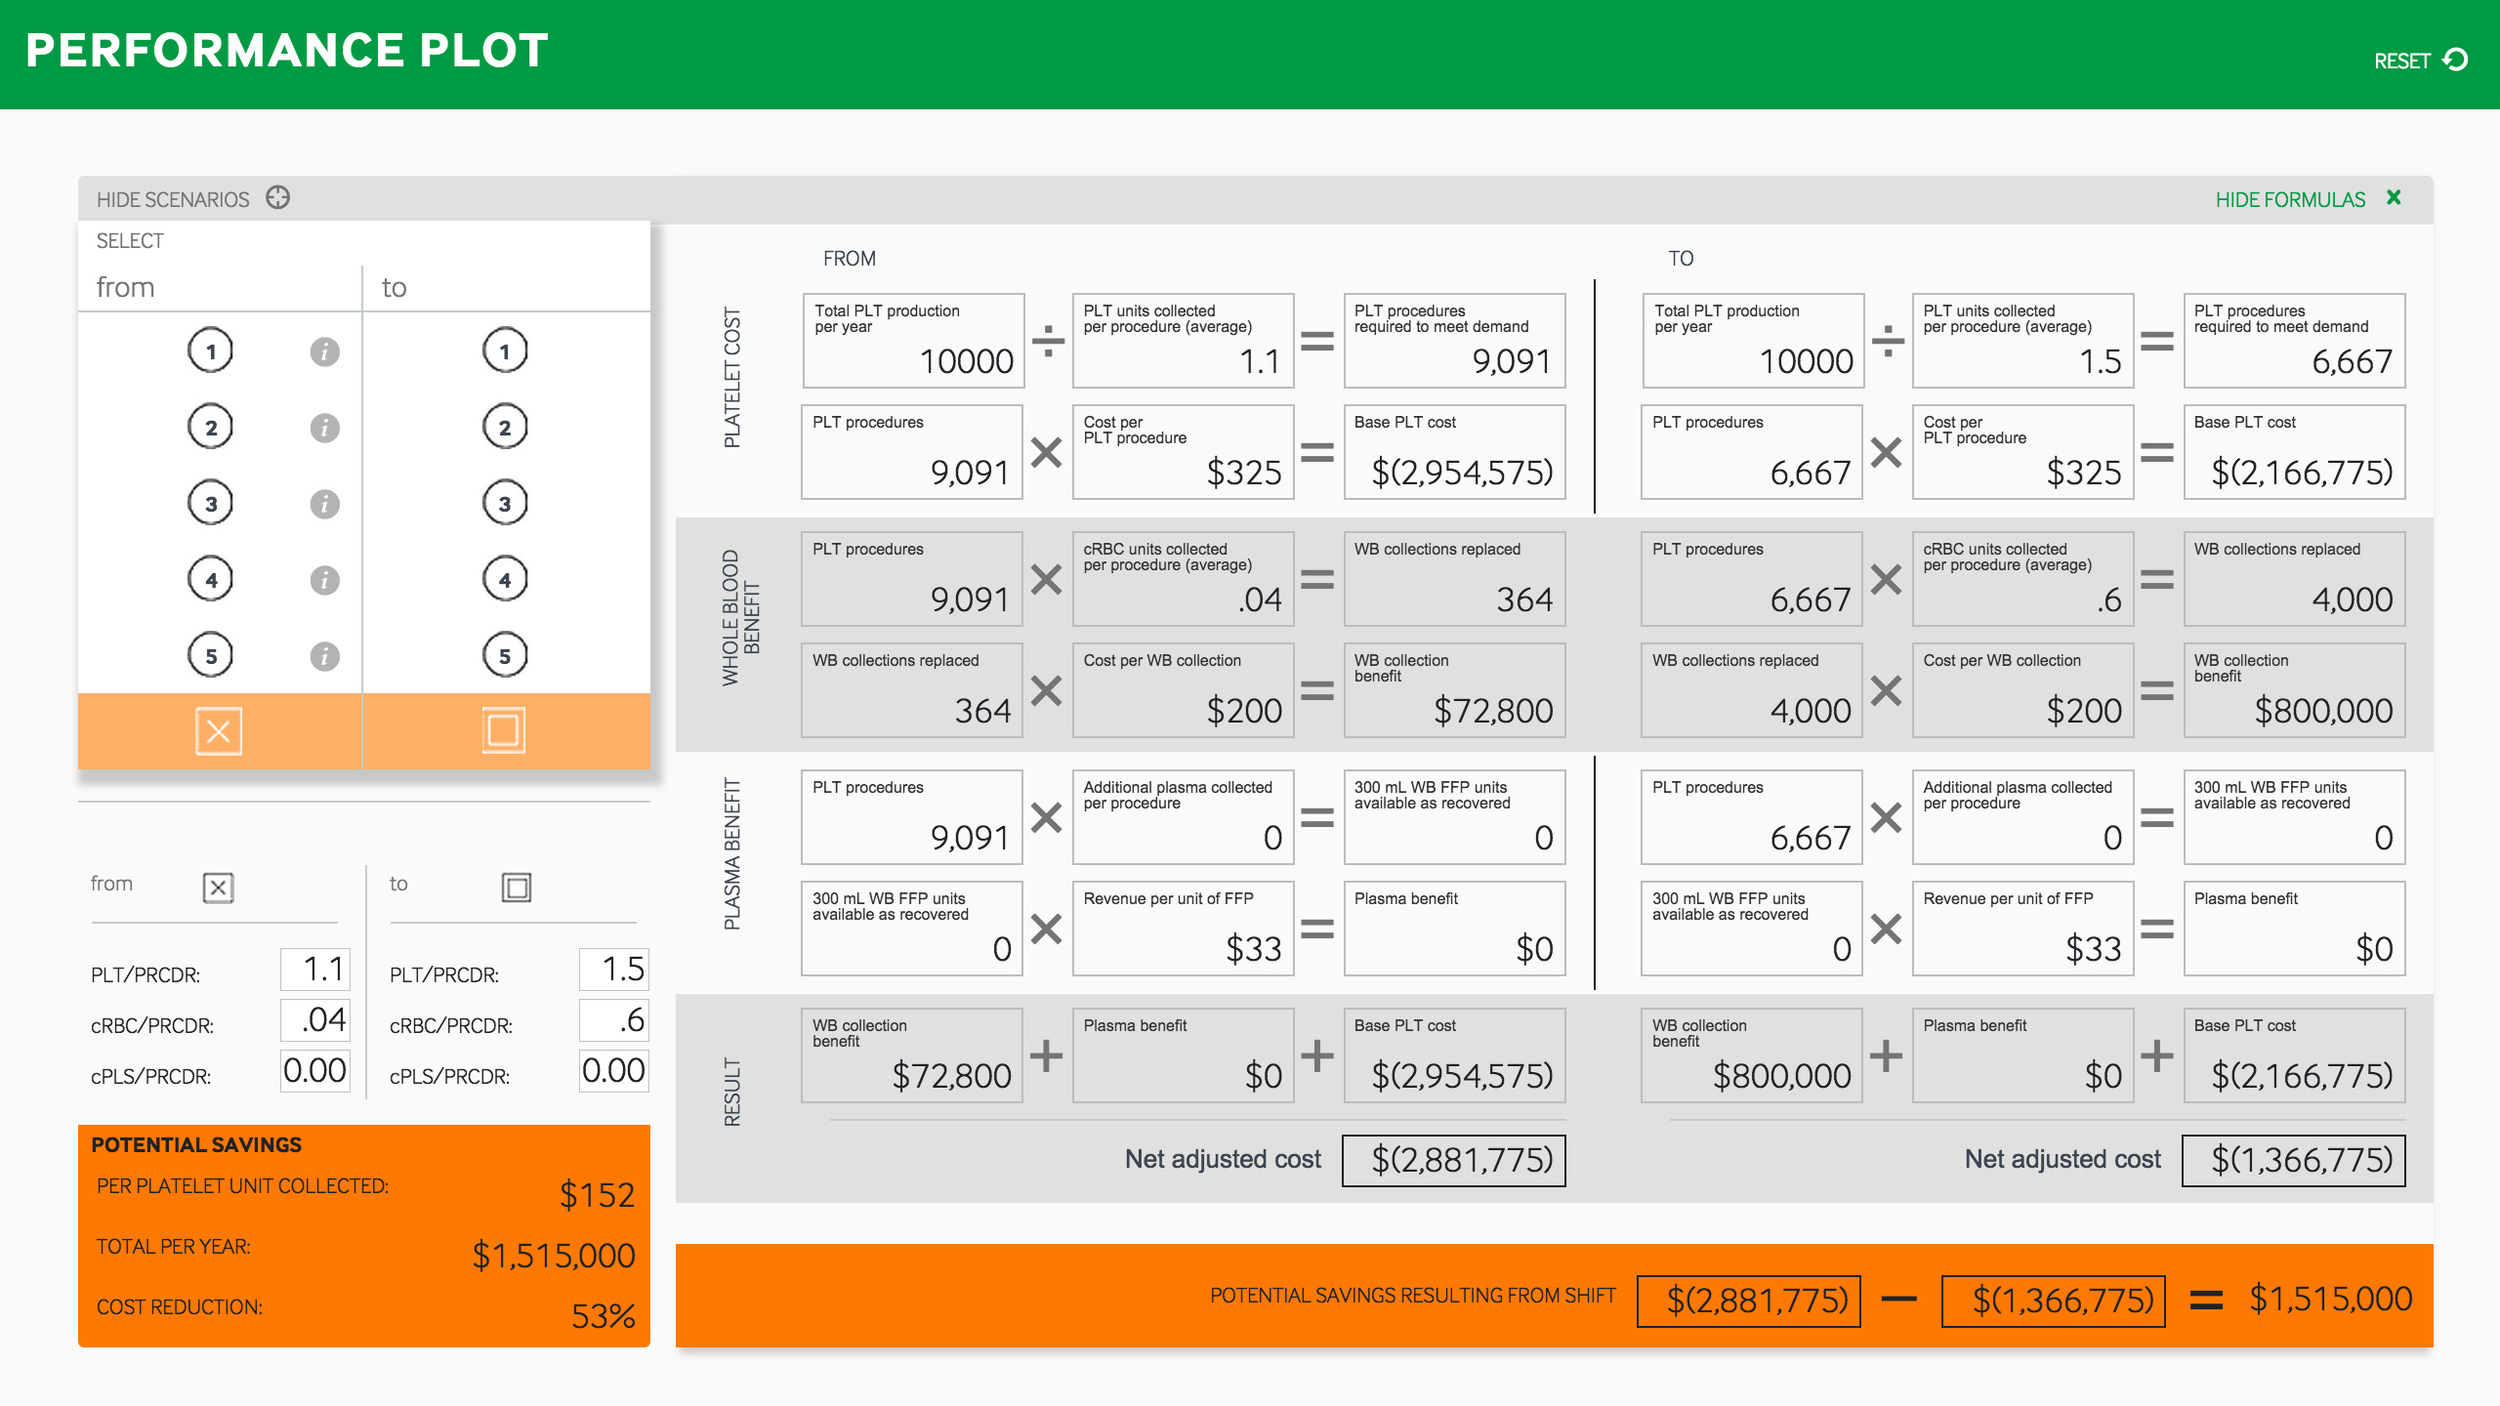
- It had to make an extremely convoluted and contingent data story into a clear and inarguable picture of the industry and the customer’s place in it
- It had to open doors for new sales conversations
The Results
Interviews to this point reveal positive reactions, from the sales team and the customers who’ve been exposed to it; however, analytics reveal only light usage of the application on the sales team. It may be that the immense challenges and downward industry trends prove overwhelming for a mature sales team, that it’s simpler to rely on tried-and-true tactics. Though a "calculator tool" had been asked for repeatedly, adoption is still slow.

The Long Version:
Blood is a Business
Think Bonfils or Red Cross (you should go donate, btw). They’re the customer in this context. Collect blood, process blood, sell blood components to hospitals. Sounds simple, but it’s a business model that survives on declining volunteerism for its supply, suffers precipitous shifts in demand almost daily, is staggeringly expensive to run, endures the most granular regulatory oversight of any manufacturing operation in existence, and is driven by the constant knowledge that the hospital you're selling to has absolutely no obligation to buy, that you’re handling human blood and lives hang in the balance. It’s highly competitive and faces commoditization and consolidation. Oh, and it’s not-for-profit. Sounds like a hoot, right?
Terumo BCT makes devices, systems and equipment that help these blood centers become more effective and efficient.
The Trima Accel System is the lynchpin product for Terumo BCT’s presence in the blood banking niche, and the platform for most of their disposable kit sales in the U.S. (Think of an Epson printer and its ink cartridges.)
Trima is an apheresis device. That means it collects blood from a donor, culls out specified components in an onboard centrifuge, pumps those into a bag and returns the unused fluid to the donor, all through a single needle. Takes a little over an hour. It looks like a small ATM machine on wheels, and operates in about two-thirds of North American blood centers. Trima directly collects platelets, plasma, and red blood cells in any combination, allowing blood centers to skip costly processing of whole blood into those components.
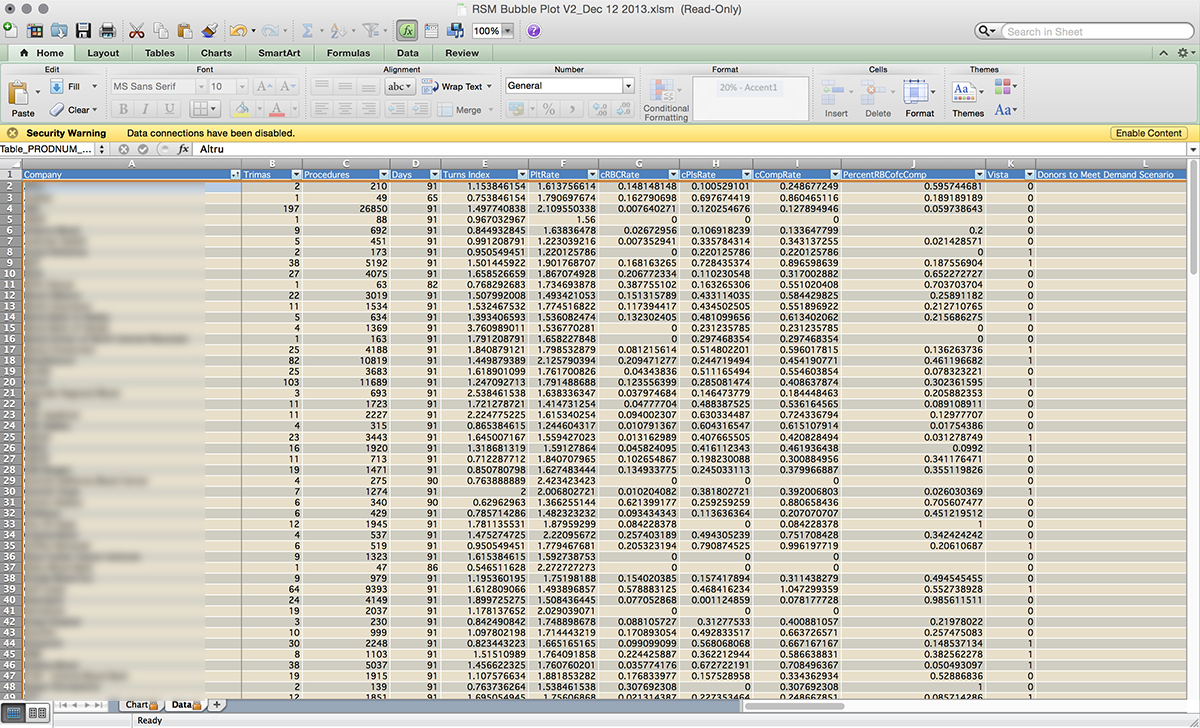
Part of the support relationship Terumo BCT has with its Trima users is data housing and maintenance. So just about every run on every Trima in the world is available for collation and analysis as long as the cable is plugged in.
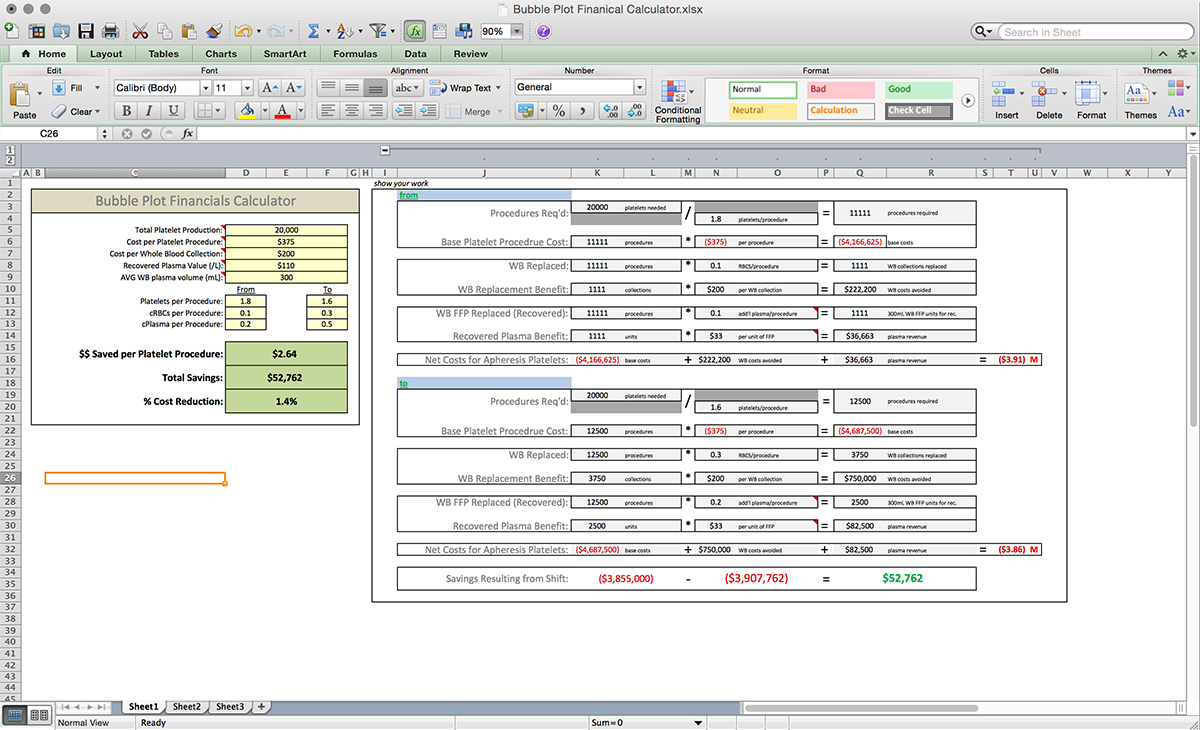
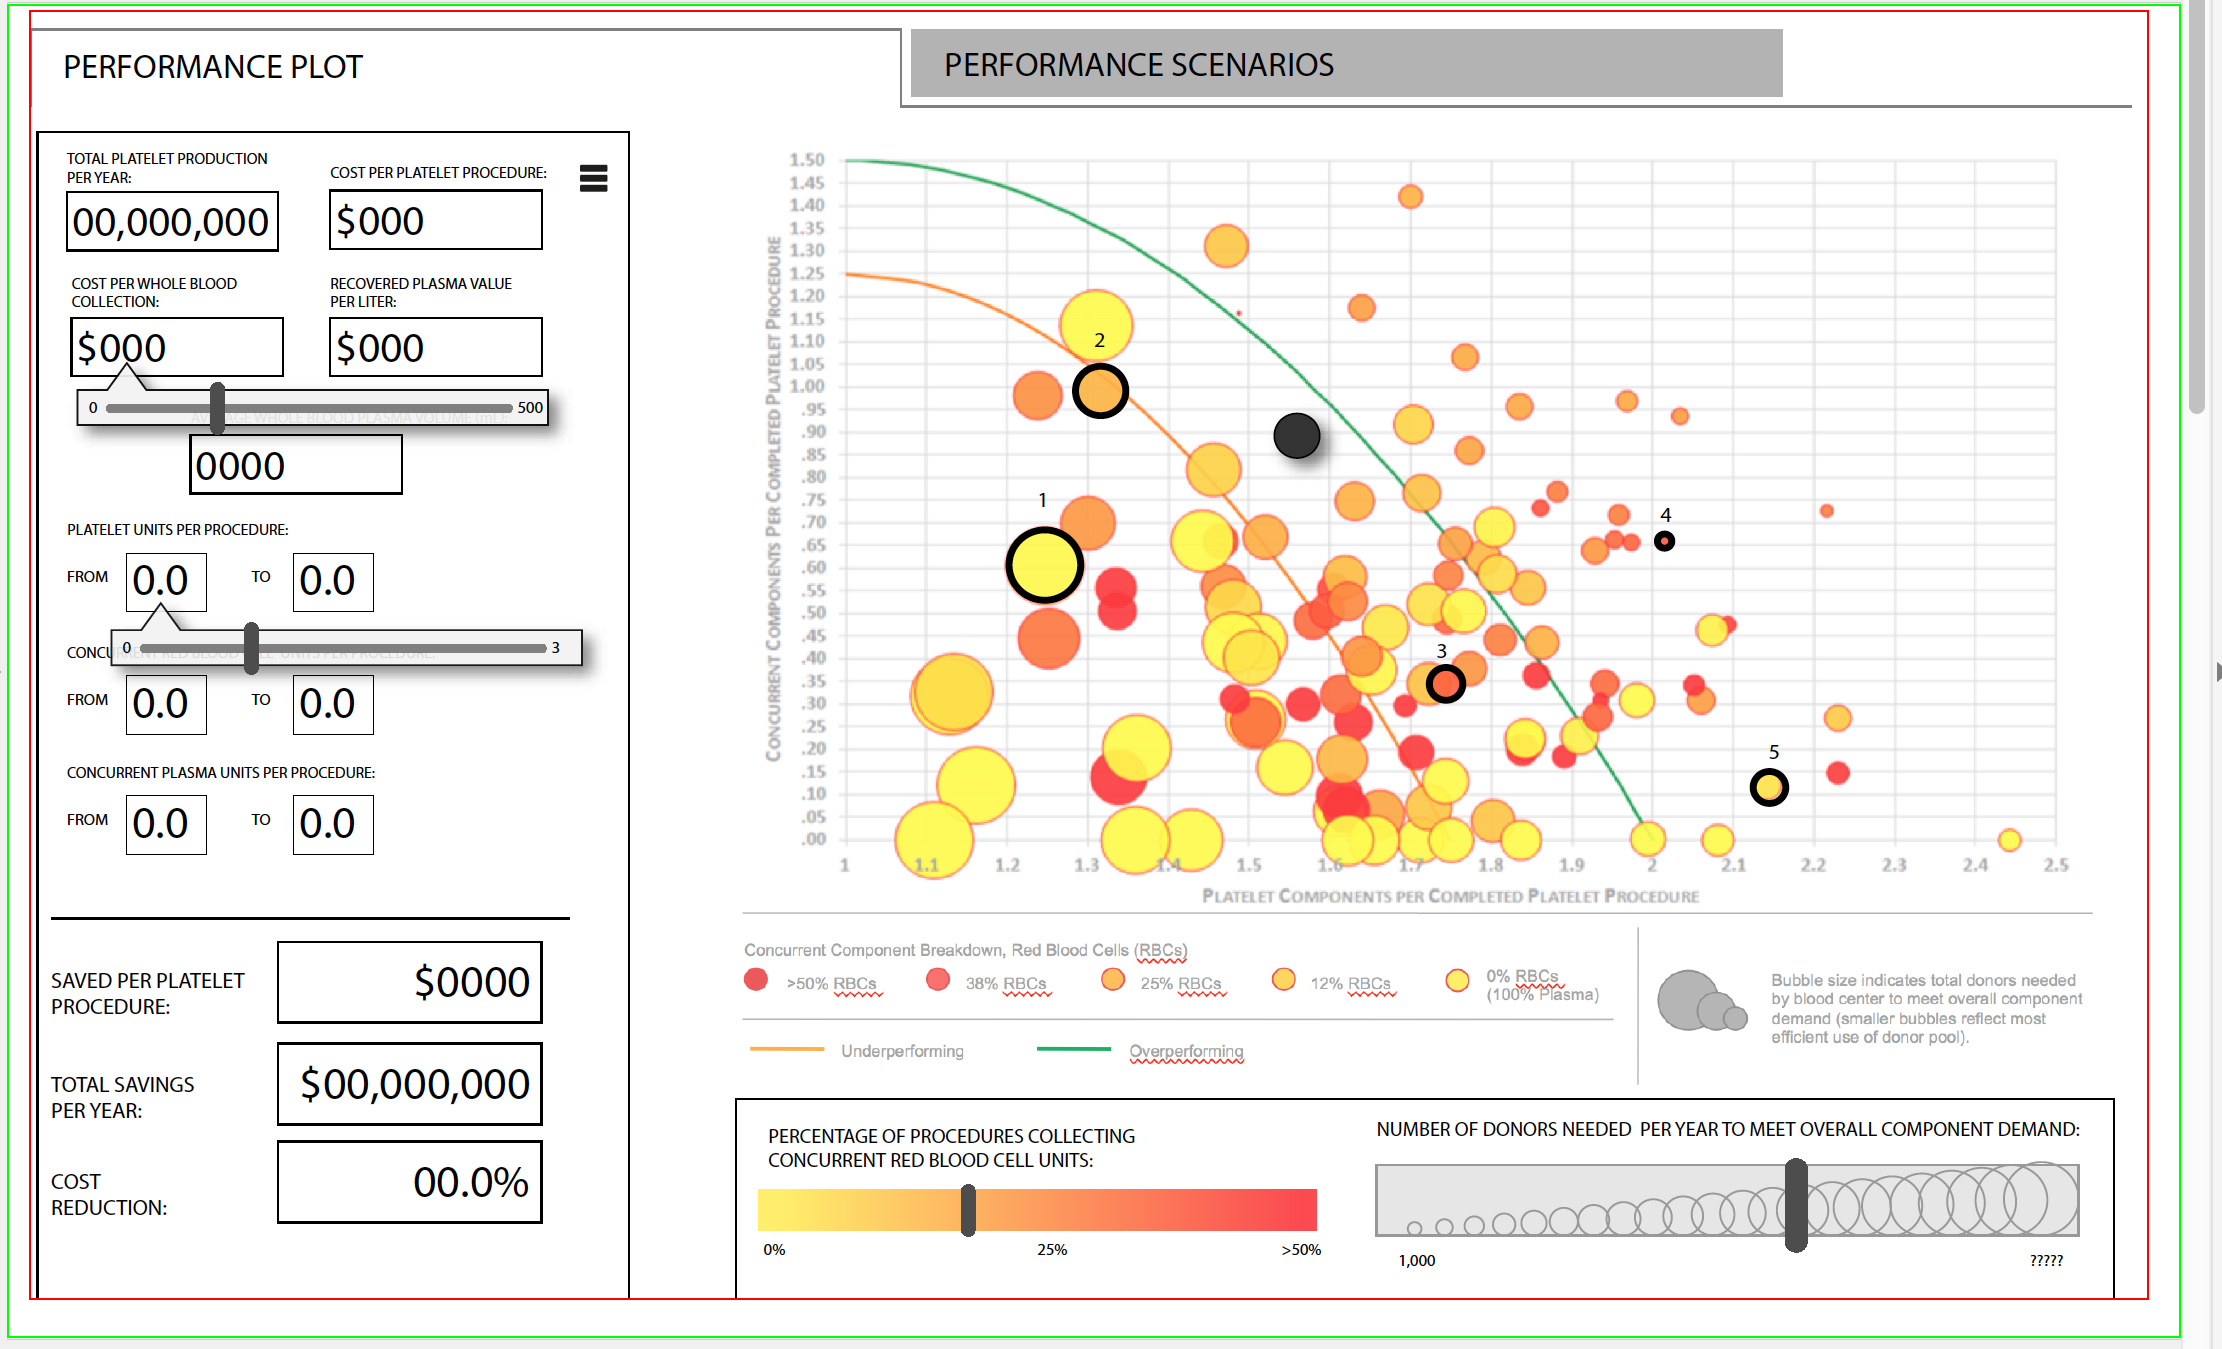
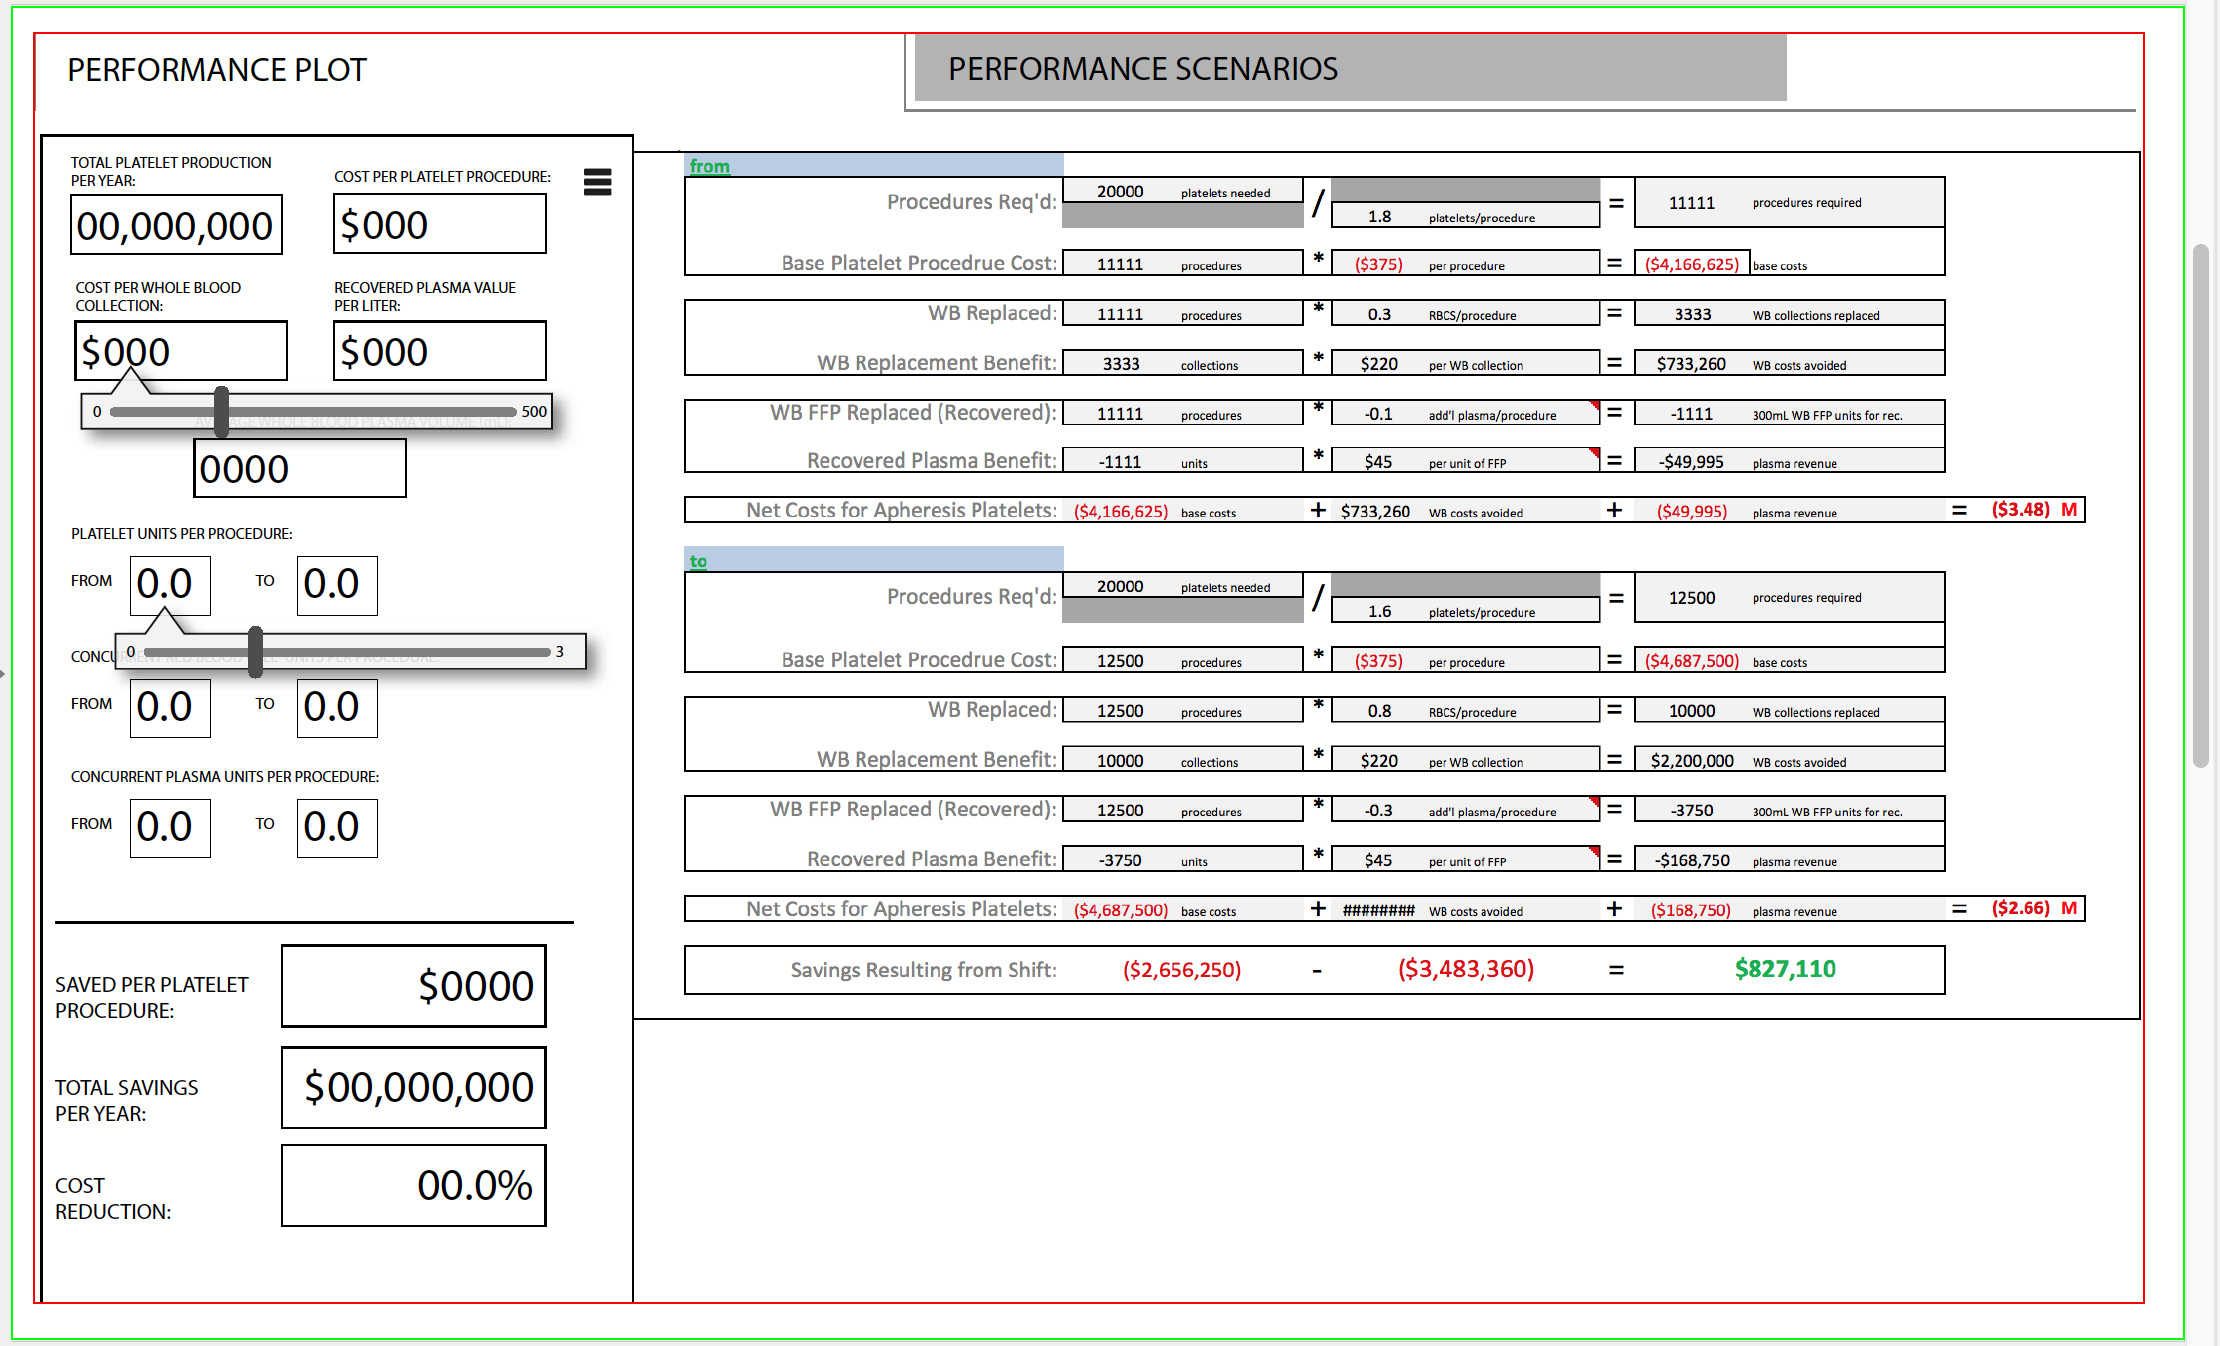
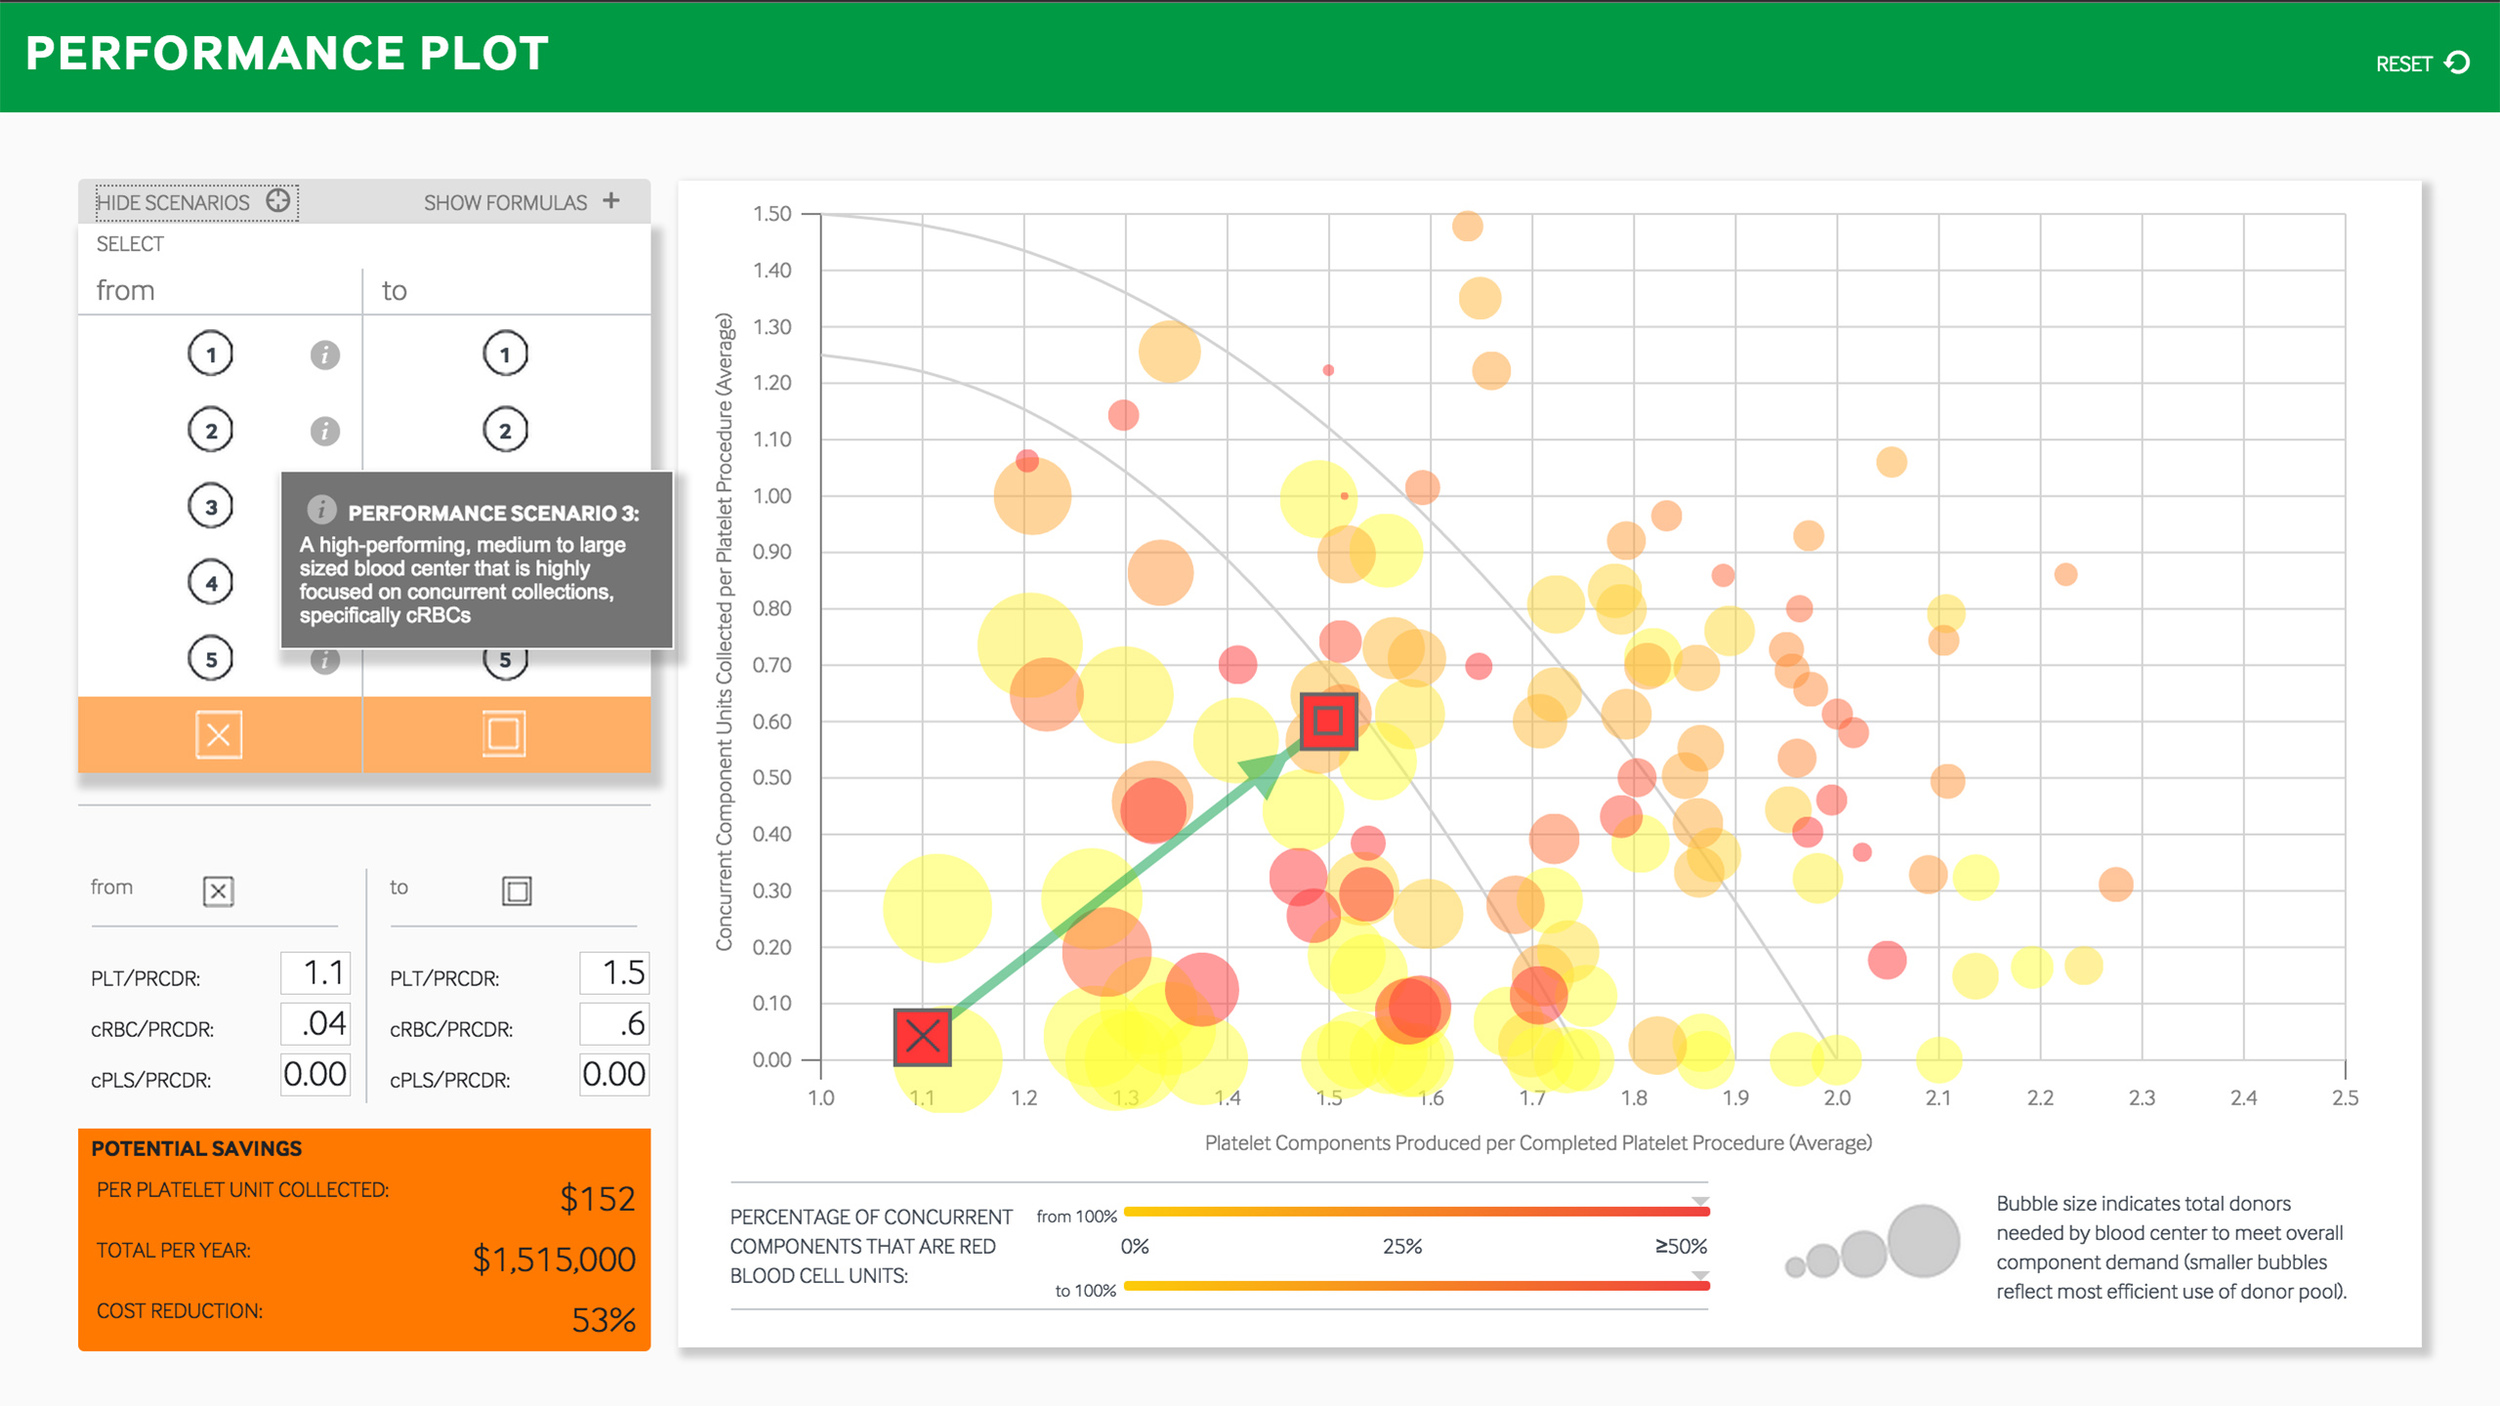
Most blood centers concentrate on just collecting platelets with Trima. It’s a cost-effective way to get that most valuable blood component into inventory. But that’s short-selling the device's capabilities. The story is, “How to Use This Really Expensive Machine to Also Collect Other Components While You're Collecting Platelets and Make More Money.” It’s called concurrent component collection, and it’s revenue a lot of Trima blood centers leave on the table.
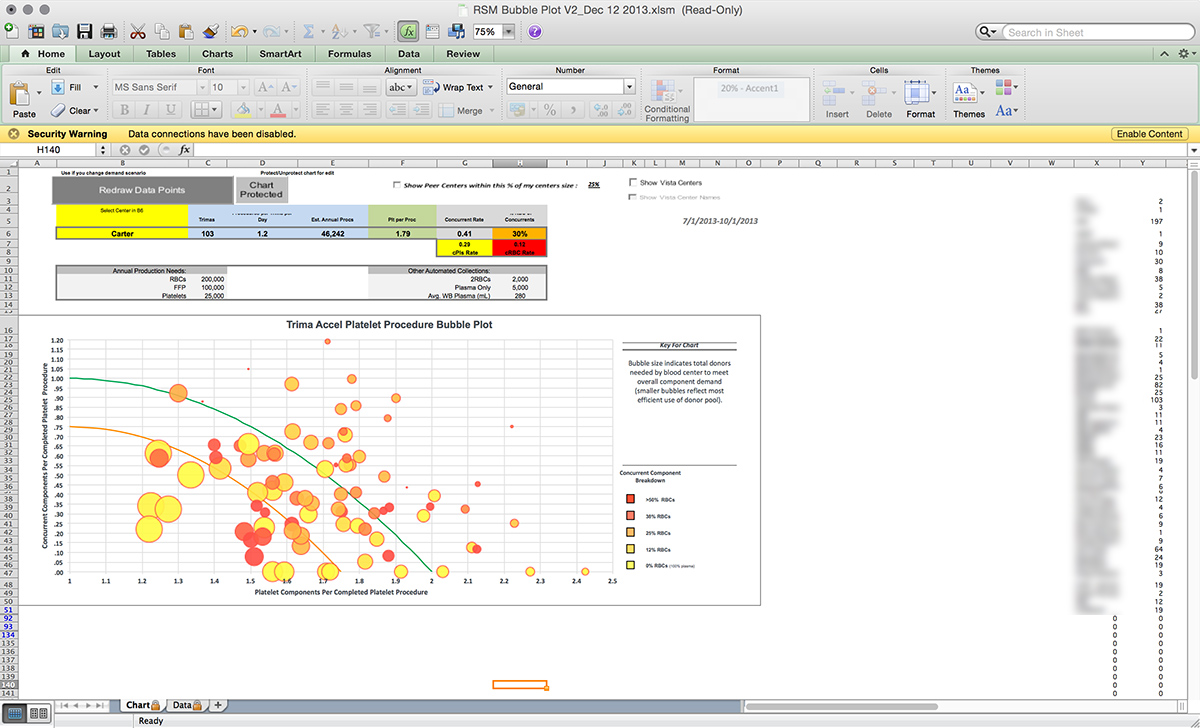
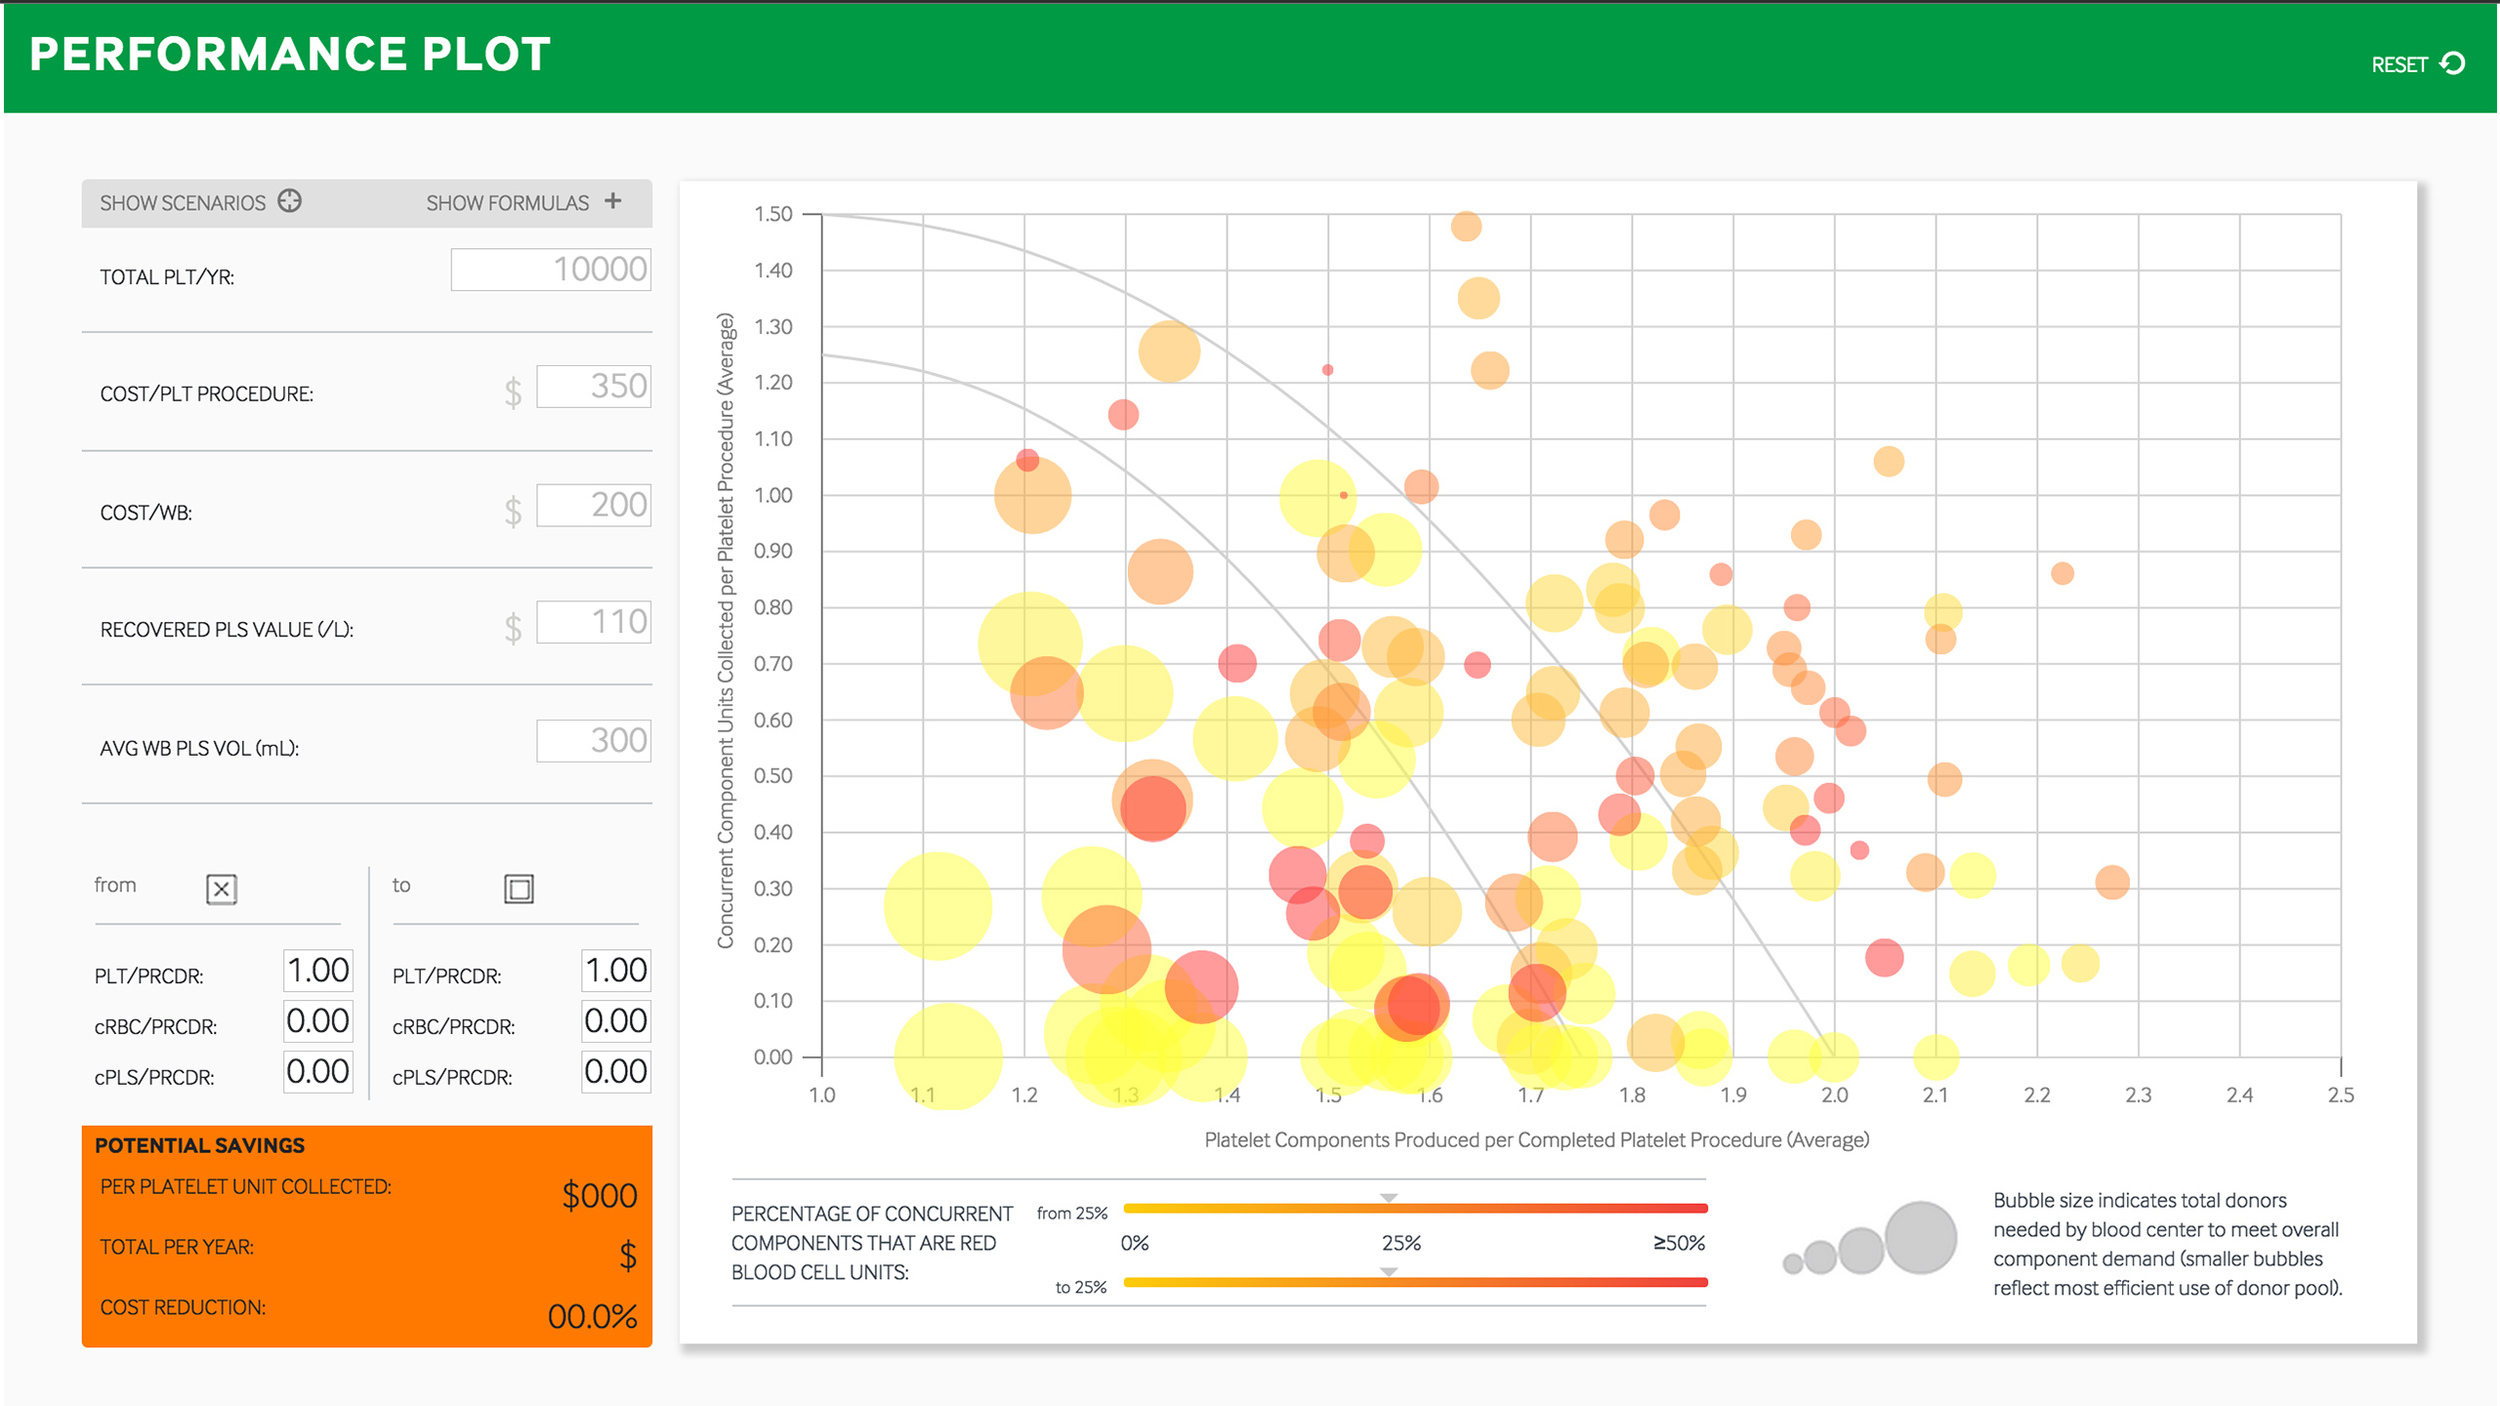
Among other things, the Performance Plot is meant to paint a monetary picture of Trima collection strategies, especially ones that collect more concurrent components.
New Tool, Old Habits
The users for this application are the Terumo BCT sales team members. They carry around in their heads, with instant recall, an invisible spreadsheet that can encompass the difficulties of an entire blood center operation. Their native knowledge and insight for this niche is unsurpassed. Seriously, do a trans-con flight next to one of these people and you’ll get off the plane looking for donor couch. It’s inspiring how hard they’ve studied this business.
It’s the kind of expertise that shines through in long-term customer relationships, but not so much with new prospects or transactional customers. It takes time to demonstrate.
So the challenge was to give the sales team a digital stage on which to quickly demonstrate expertise and depth of knowledge without tripping them up in the details.
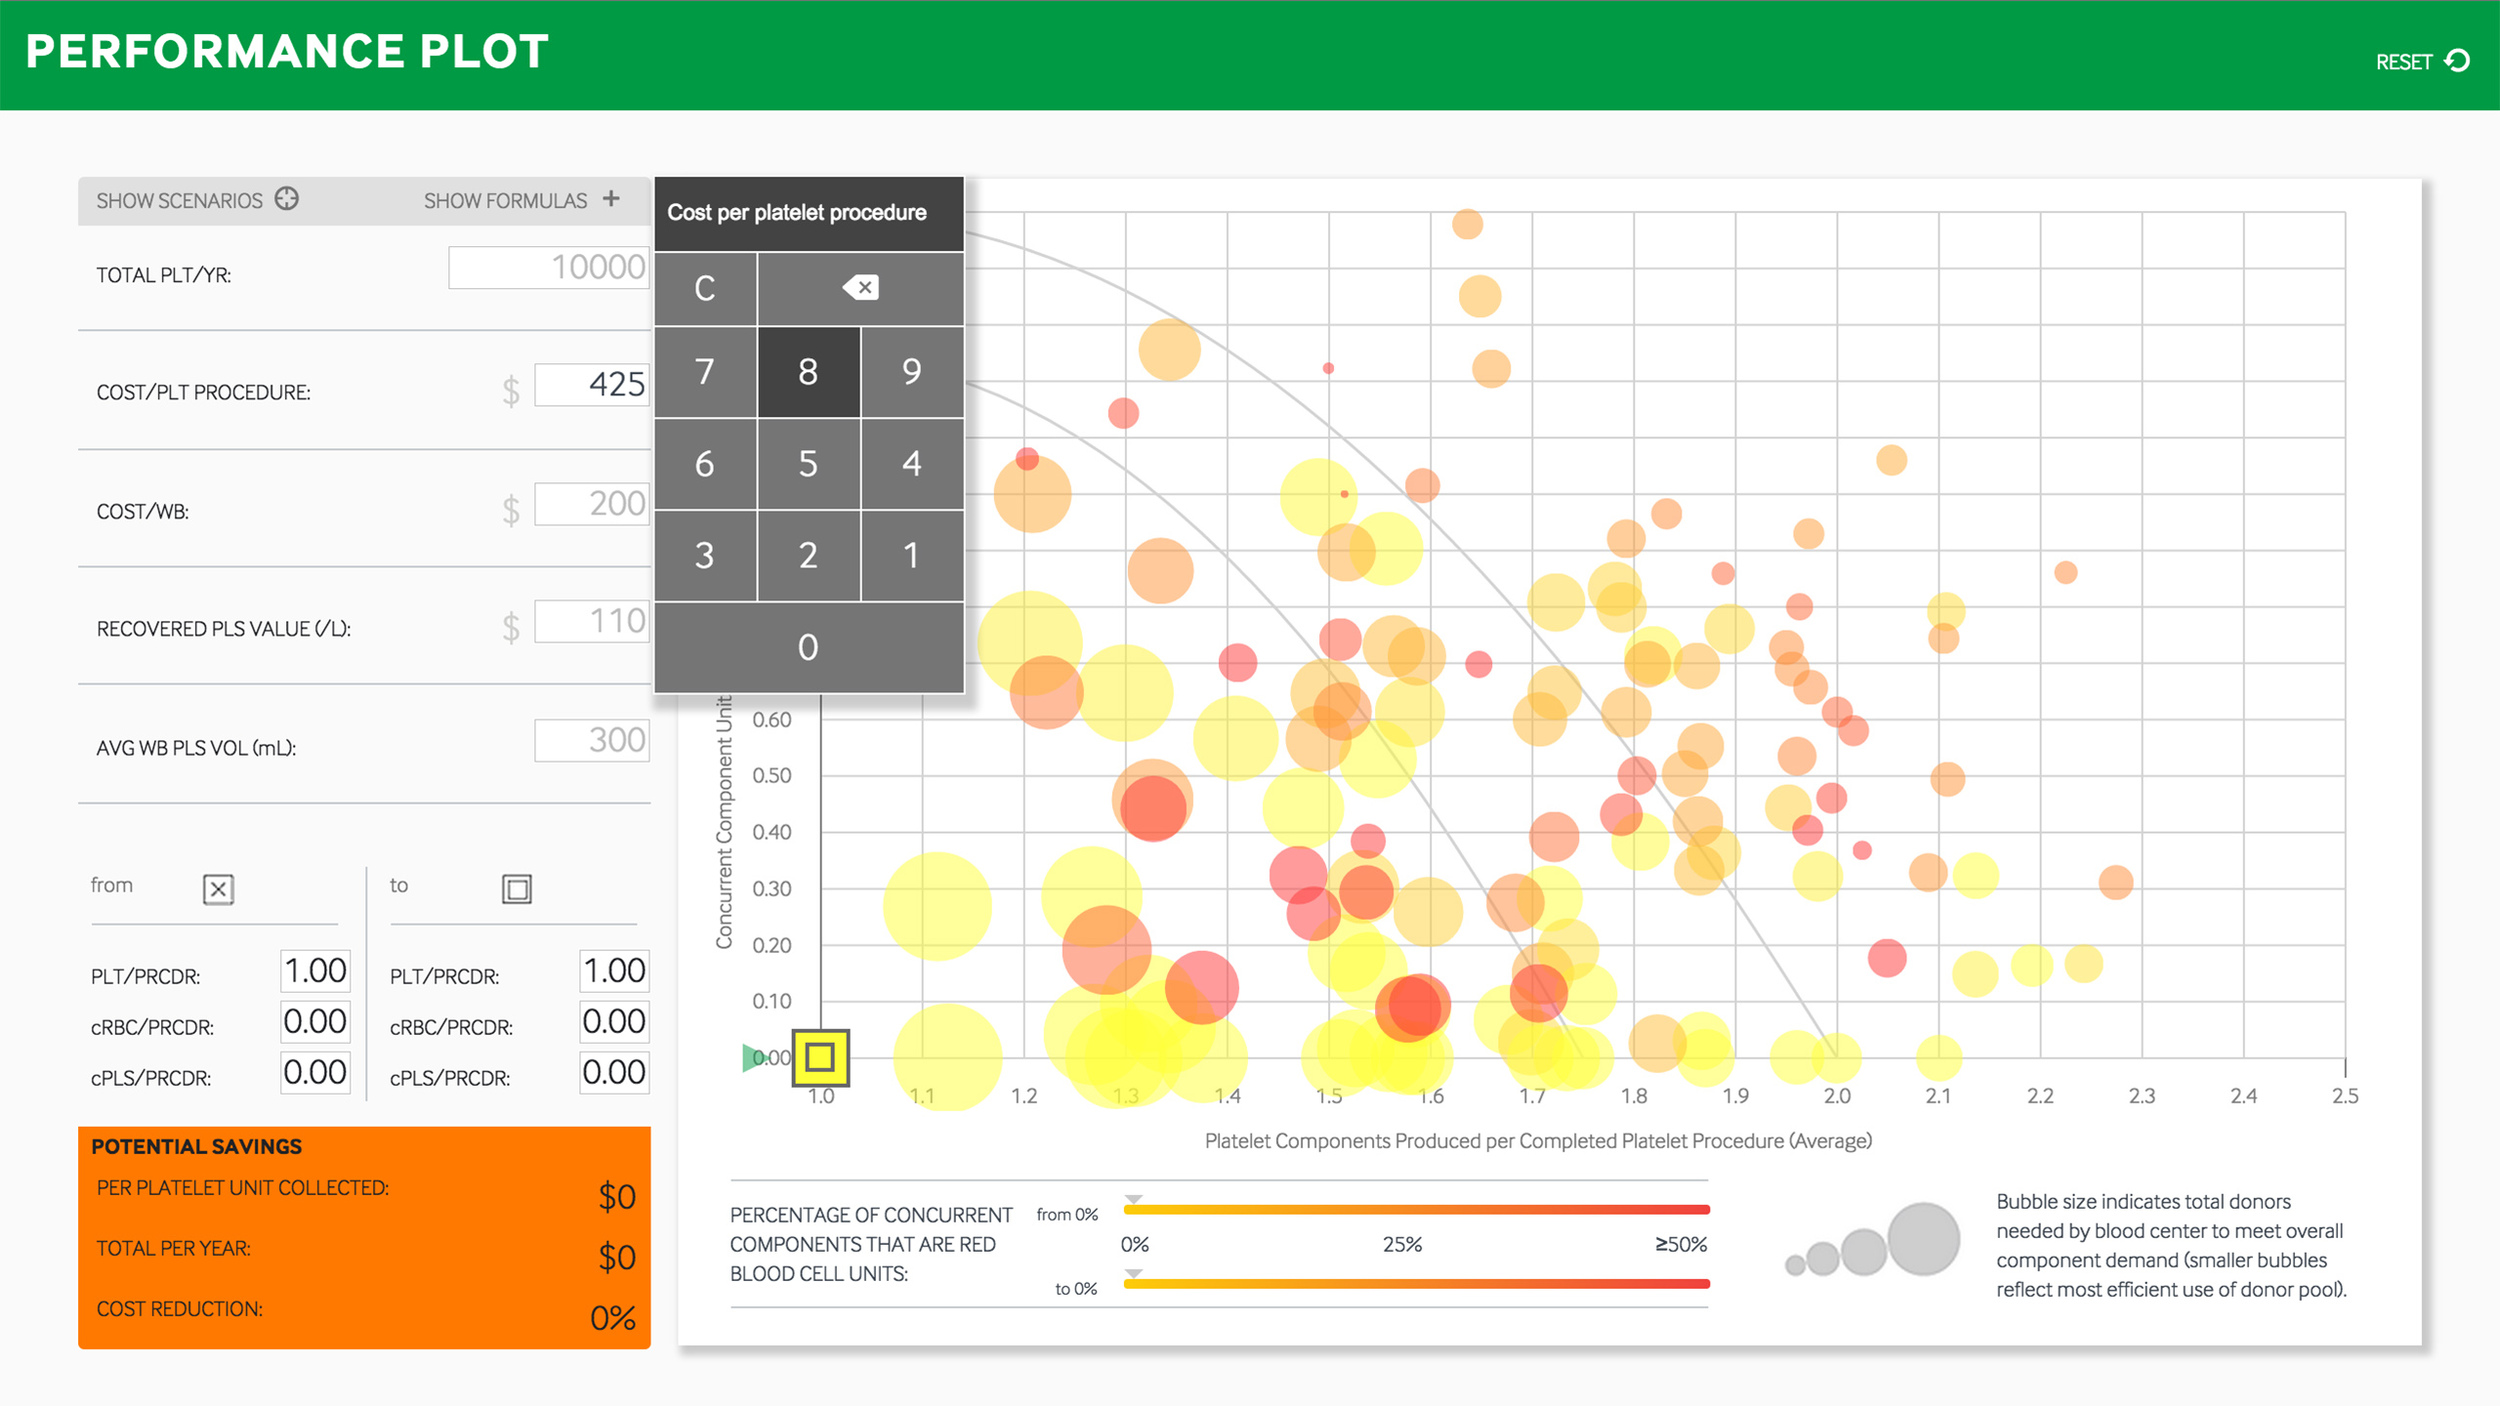
They’re blood center business experts, but not necessarily tech-savvy. The setup had to be short:
“This is a visualization of blood center performance. Each circle on this plot is a real blood center, collecting blood components on real Trimas, just like you. I’ll show you where you currently sit, ask you where you’d like to be, and then we ought to talk about what it’d take to get you there.”
Terumo BCT has for several years now been transitioning to a more consultative sales approach. This application is a direct result of that imperative. That’s why there’s no product in it.
It’s meant to culminate a lot of pain points for customers, to lay them out in plain sight and show them that we’re not just here to push gear on them…that we empathize, that we understand, that our perspective is large enough and our intelligence resources deep enough to be helpful.
Slow Adoption
To date, analytics reveal only light usage of the application on the sales team. It may be that the immense challenges and downward industry trends prove overwhelming for a mature sales team, that it’s simpler to rely on tried-and-true tactics. Many of them are just more comfortable with their old tools, and screenshots of this app probably abound in company PowerPoint decks around the country. I won’t hold it against them. It may be that they just don’t want another tool in the bag.
Interviews to this point reveal positive reactions, from the sales team and the customers who’ve been exposed to it.
More post-launch discovery is certainly warranted, but experience tells me that this is a very mature industry that is only beginning to feel the ramifications of the healthcare sector sea change. Customer interest is shifting to diversification; optimization becomes a more difficult topic in that context.
Of the sales team members who’ve reported using it, positive results follow. Conversations continue, interest grows, relationships expand.
If the application moves the company's needle at all, even in one conversation with one rep and one phlebotomist, we've succeeded.